The water on our planet is estimated at about 1’409’560’910 km3 of volume.
The breakdown into compartments with different characteristics and is described in the following link:
https://www.usgs.gov/special-topics/water-science-school/science/where-earths-water
| Water source | Percent of |
| total water | |
| Oceans, Seas, & Bays | 94.92318% |
| Ice caps, Glaciers, & Permanent Snow | 1.70720% |
| Groundwater | 1.66009% |
| Fresh | 0.74704% |
| Saline | 0.91305% |
| Soil Moisture | 0.00117% |
| Ground Ice & Permafrost | 0.02128% |
| Lakes | 0.01251% |
| Fresh | 0.00646% |
| Saline | 0.00606% |
| Atmosphere | 0.00092% |
| Swamp Water | 0.00081% |
| Rivers | 0.00015% |
| Biological Water | 0.00008% |
The water potentially usable by the living beings (percentages in bold) amounts to about 23’896’140 km3 corresponding to 1.70% of all water on the planet (1’409’560’910 km3).
Of the potentially available only one part is available for a conventional use.
NASA measured via satellite, for 15 years starting in 2002, the variations in the distribution of fresh water around the planet. https://svs.gsfc.nasa.gov/12950/ . At NASA “they found that water supplies in some regions are relatively stable, others have experienced increases or decreases. Climate change has led to the loss of fresh water from ice sheets to the poles, which has implications for rising sea levels. Other areas have seen groundwater depletion due to the use of water for crop irrigation or increases due to higher amounts of rainfall due to natural variability.”
The U.S. EPA outlines important indicators regarding global rainfall and its swalts from 1900 to 2020.
The figure shows how the total annual amount of precipitation on earth around the world has changed since 1901. This chart uses the 1901-2000 mean as the baseline to represent the change. Choosing a different base period would not change the shape of the data over time. In the first approximation it can be said that from the 1950s to the present the total annual rainfall on earth has increased compared to the average of the reference period of 1-2 inch (25-50mm) values that do not represent, however, a large variation in quantitative terms on the average annual Earth value.

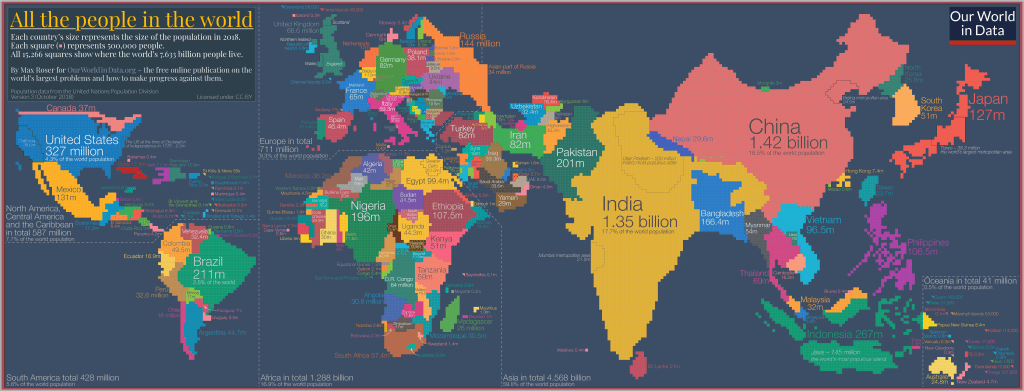
The site https://ourworldindata.org/water-use-stress also based on the data collected and prepared by the most important and reliable world institutions (UN, FAO, World Bank) illustrates through a series of mobile graphs the variations of the “stress” to which the Earth’s water system is subjected.

The collection and use of water is constantly growing and from 1950 onwards the speed of consumption has doubled compared to the first half of the 19th century.
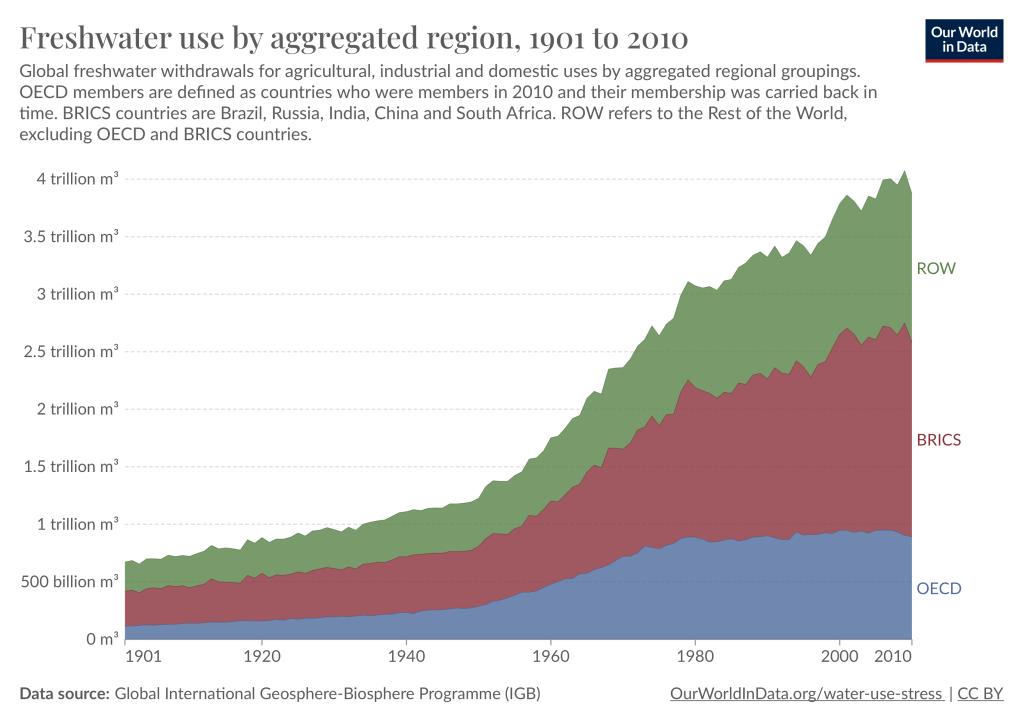
The largest consumers are in the order the BRICS countries (Brazil, Russia, India, China and South Africa) followed by the OECD countries and all other countries.
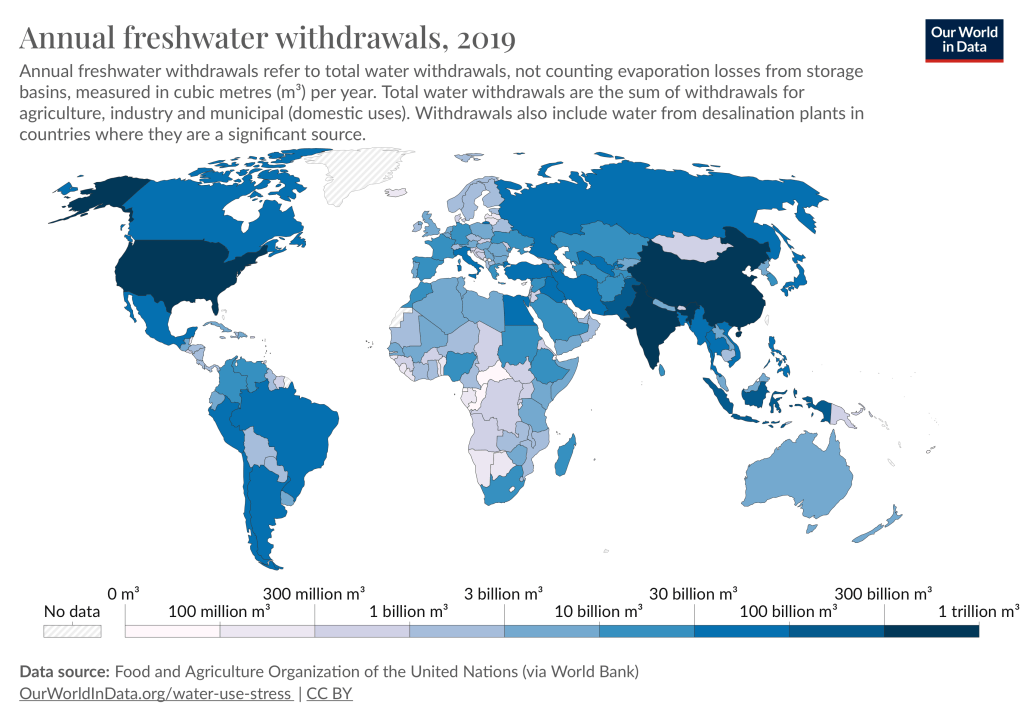
In 2019, the withdrawal and consumption situation shows the variability of water withdrawal on Earth.
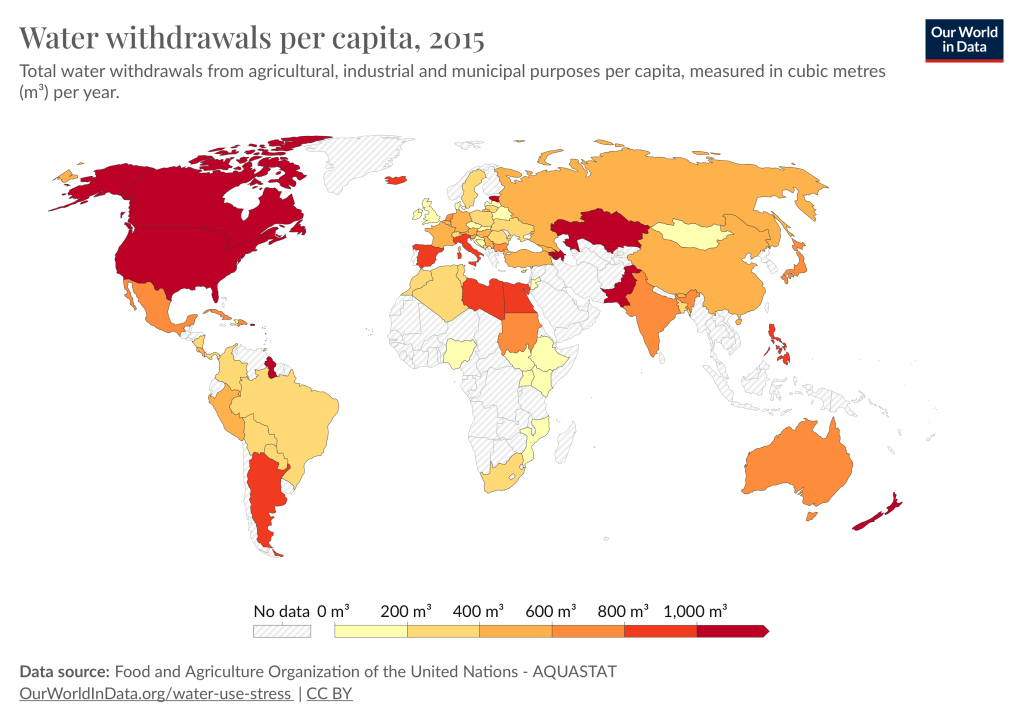
Per capita use in 2015 was particularly high in North America, Kazakhstan, Pakistan followed by other countries that are largely dependent on water for agricultural and livestock purposes.
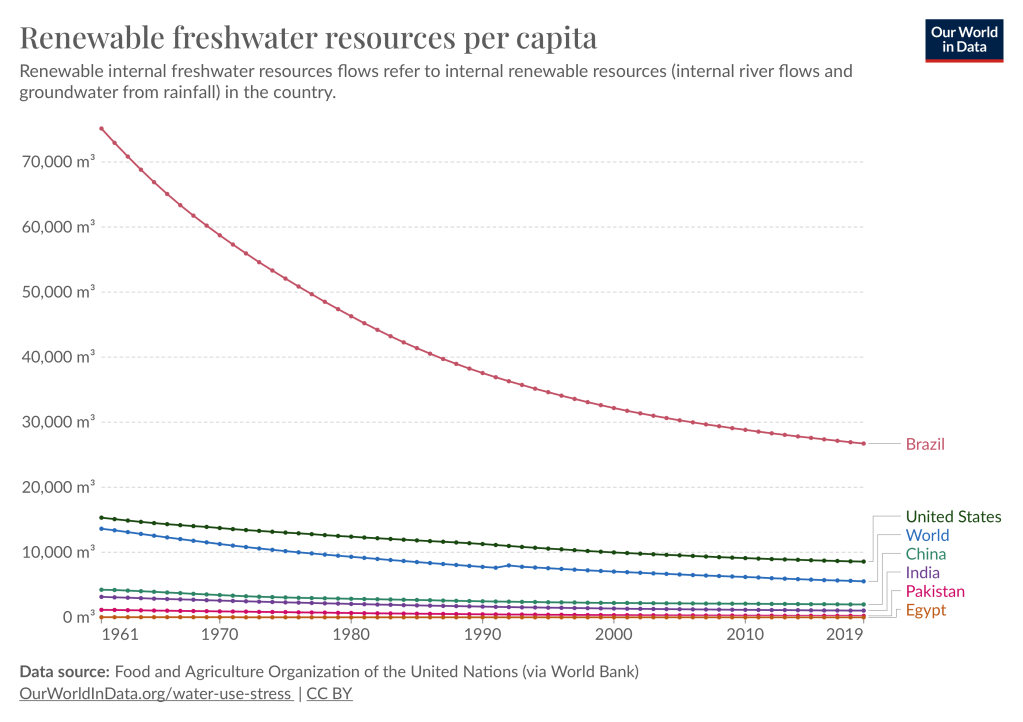
In countries where water withdrawal exceeds renewable flow, the ‘water resource’ decreases. This trend is also correlated with the increase in the world’s population.
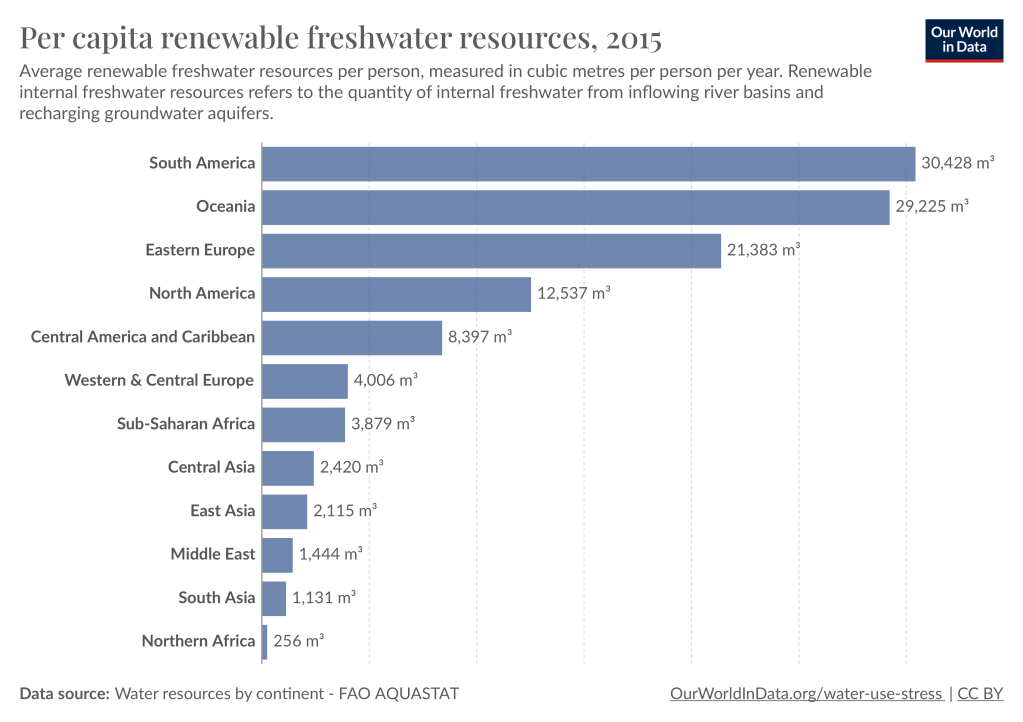
Water resources, in m3/per capita, for geographically aggregated nations shows that from Central & Western Europe to North Africa decreases sharply.
The site https://www.usgs.gov/special-topics/water-science-school/science/where-earths-water illustrates the data and sampling maps for the different uses: agriculture, irrigation, industrial, domestic and public.
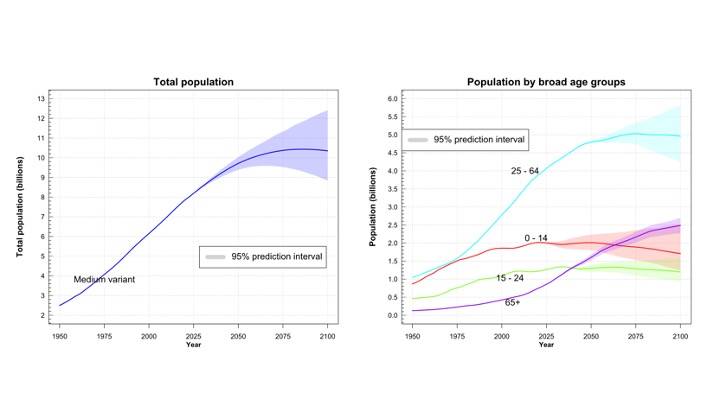
Given the increase in the world’s population since the 1950s and the growth prospects for the next 50 years, it is likely to expect a crisis in the availability of drinking water and clean water for agricultural and industrial uses. To this must be added the increase in the need for clean water to support the populations of developing countries.
In an upcoming blog we will address the situation of global water stress.

Leave a comment